From zero to Docker: Monitoring your system with cAdvisor
So we started dropping Docker containers on our droplet (see what I did there?). Checking the graphs on DigitalOcean’s control panel, wee see some nice stats… but they are for the server as a whole. How can you see how much CPU/memory/network each container is using?
Lucky us, Google provides a project to do just that: cAdvisor. It can also show resource usage for the whole server, but you can easily filter each container individually. In a nice dockerized way, all you need to do is deploy the google/cadvisor image with the proper volumes mounted:
docker run -d \\
  --name=cadvisor \\
  -v /:/rootfs:ro \\
    -v /var/run:/var/run:rw \\
    -v /sys:/sys:ro \\
    -v /var/lib/docker/:/var/lib/docker:ro \\
  google/cadvisor:latest
As you can see, we haven’t published any ports - the docker image itself exposes port 8080, so we’ll just add an entry to our DNS and proxy everything through nginx:
server {
  listen              80;
  server_name         status.marcelofs.com;
  location     /   {
    proxy_pass        http://cadvisor:8080;
    proxy_set_header  X-Forwarded-Host  $server_name;
    proxy_set_header  Host        $server_name;
    proxy_set_header  X-Real-IP      $remote_addr;
  }
}
That means you’ll have to restart your nginx container linking to the cAdvisor container, but after that just visit your server on the new subdomain. Want to see this server’s resource usage? Here you go. It probably won’t replace cacti anytime soon, but who said they can’t work together?
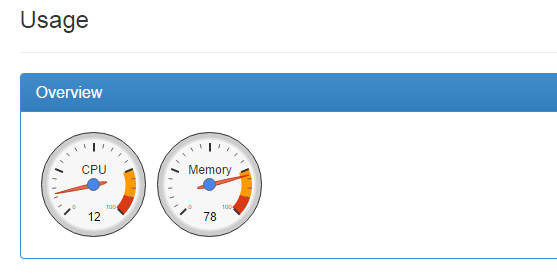
So I’ve just seen this server is running at ~80% memory. Listing each container individually, we can see that Ghost is using ~130MB, nginx ~4MB, and cAdvisor ~18MB.
ProTip: The standard DigitalOcean Docker image does not come with swapping enabled. Use this tutorial to enable it!
